
The safety numbers leadership can act on.
TRIR, DART and LTIFR to the OSHA 200,000-hour standard, rolling 12-month trends, and per-NAICS benchmarks — rolled up live across every pit, plant and quarry. No month-end spreadsheet reconciliation.
Know where you stand — and where to act
Standard rates, real benchmarks and the trends that matter, without the manual maths. A glimpse of what's inside.
OSHA-standard rates
TRIR, DART and LTIFR to the 200,000-hour standard — computed accurately, with data-integrity checks built in.
Industry benchmarks
Compare each site to per-NAICS BLS and MSHA benchmarks, with clear below / at / above flags.
Trends that matter
Rolling 12-month trends and year-over-year % change, plus incident breakdowns by type and site.
Role-scoped dashboards
Every role — from site supervisor to super-admin — sees the numbers scoped to what they own.
Safety Metric Dashboard
Every recordable rate, benchmark and trend leadership needs on one screen — read live, with each number drilling straight to the incident behind it.
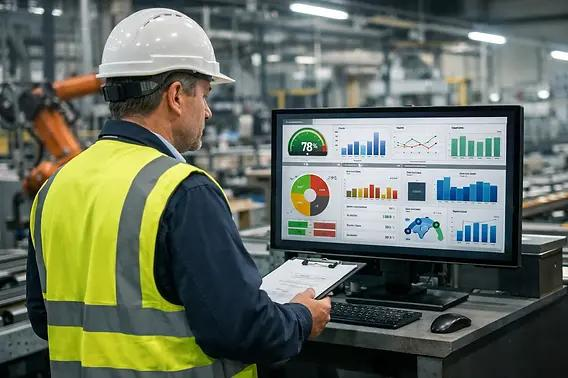
Board-Ready Reporting
Metrics are calculated per affected person, not per incident — so when a single event involves multiple injured workers, the number leadership sees reflects the true scale, counted the way regulators require.
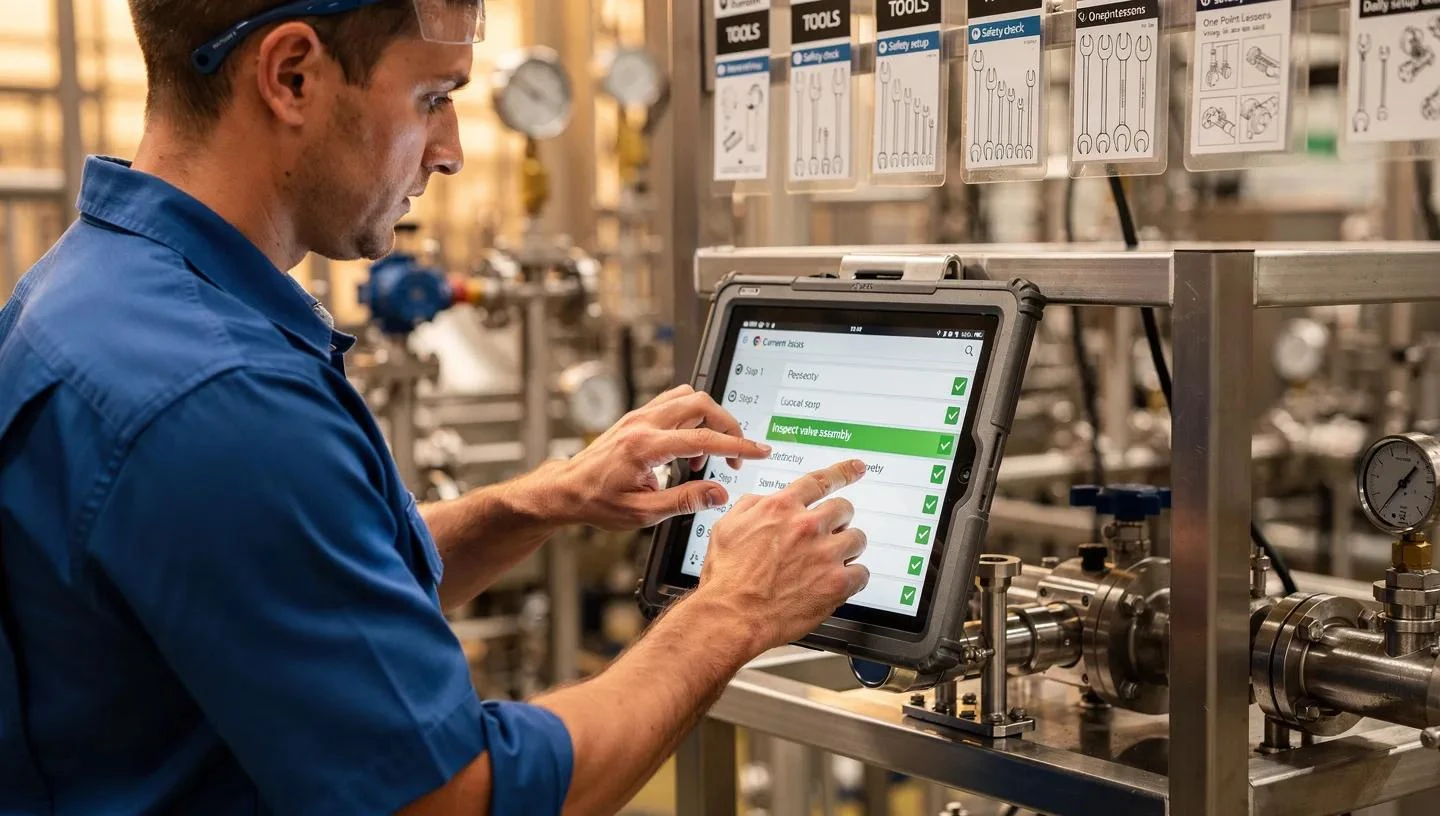
Stop the same incident happening twice
Sentinel AI finds the root causes and repeating patterns across your history and drafts the management-ready report — turning a stack of records into the few actions that break the cycle.
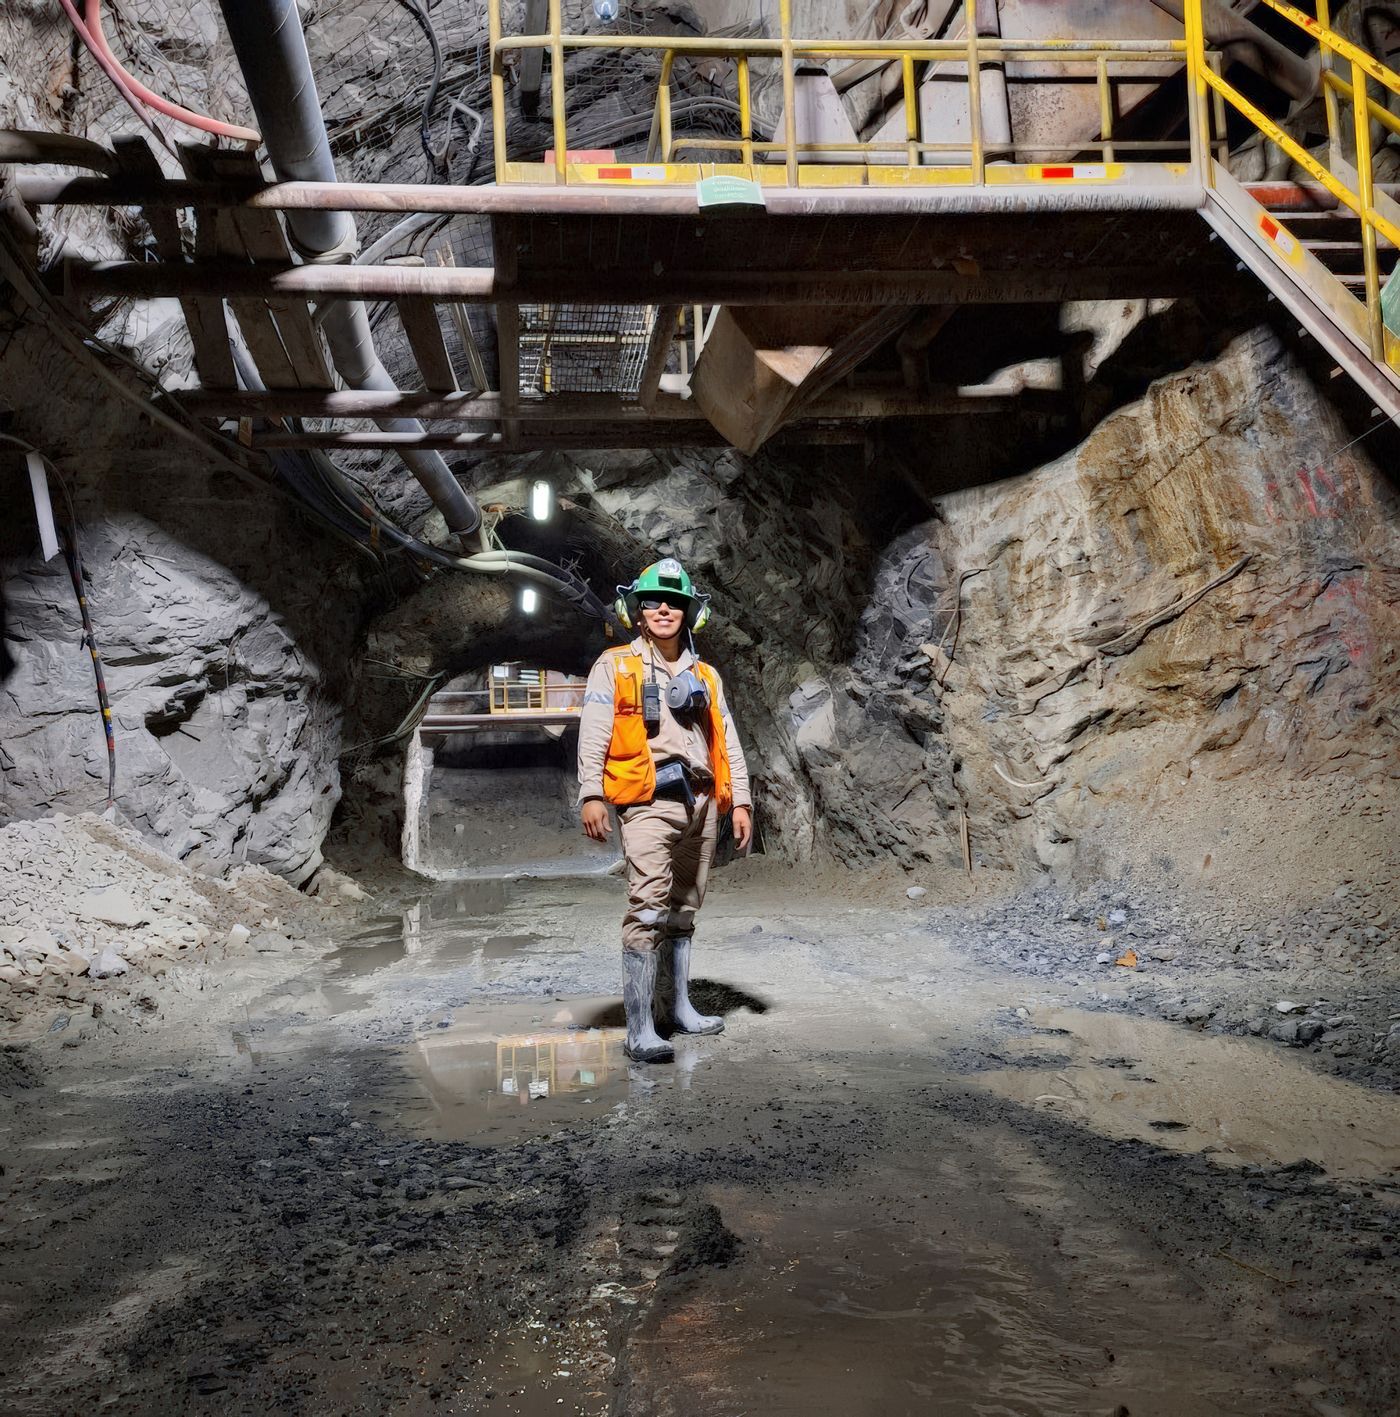 Predictive Safety Intelligence
See your safety performance, benchmarked
We'll build the leadership dashboard for your sites — TRIR, DART, LTIFR and benchmarks — in a 20-minute walkthrough.